17 new patients in 31 days. Verified in the practice's own charts, not my dashboard.
An orthodontic practice in Los Angeles County. 1 campaign I built, filmed and ran. Here's the whole case, and how I know the numbers are real. Nobody shows you that part.
On $2,270 of ad spend. That was August, on $73 a day.
Once I knew which ads were winning, I recommended the practice more than double its budget. A week on the bigger budget, October 5 to 11, added 14 new patients to its records, at a lower cost per patient than August.
How I know these numbers are real
Every marketer shows you a dashboard. Dashboards count clicks. Clicks aren't patients. So I did it the slow way: I took every lead my campaign captured and looked for them, one by one, in the practice's own patient system.
17 of my captured leads exist as new patient records in the practice's chart system. If a chart was opened before the inquiry came in, I drop it, however well the name fits.
Midway through the window, I checked the 13 patients known so far, line by line. 12 of the 13 carried "Booked By: Website" in the practice's own appointment book. That's their field, in their software. Not mine.
1 lead my tracker called "booked" had no chart and no appointment on their side. I left them out. Verification has to be able to subtract.
I match on phone number first, because parents fill in forms for their kids. 2 patients were matched by name: the practice had a different number for 1 and no number for the other. If I can't confirm a patient in the practice's records, I say so.

Against the industry's own numbers
These numbers come from the practice's patient campaign for the stated window, not everything they spent. A separate test ran alongside it, found no audience and was paused. It's reported on its own. Nothing from it is blended in below.
| Metric (31 days) | This campaign | Industry benchmark |
|---|---|---|
| Cost per click | $2.77 | $5.70 |
| Click-through rate | 2.19% | 1.62% |
| Ad spend per additional patient, my fee not included | $133.54 | $533 average patient acquisition cost for orthodontics, First Page Sage |
Each patient added cost $133.54 in ad spend, my fee not included. The published average is $533 per orthodontic patient.
Benchmark sources: LocaliQ Facebook advertising benchmarks (lead campaigns, dentists and dental services: cost per click $5.70, click-through 1.62%; page updated September 23 2026) · First Page Sage, Average Patient Acquisition Cost: 2026 Report ($533 patient acquisition cost for orthodontics, 8 practices reporting, page updated September 21 2026; the report doesn't say what the figure includes). My figures come from the campaign's ad account and the practice's records for the stated windows. Cost per click and click-through rate count all clicks on both sides, which is LocaliQ's own definition: total spend divided by total number of clicks.
What the campaign actually was
It's 1 orthodontist and 1 staff member who isn't always in, so he sometimes runs the consult alone, and a lot of his starts happen at 5pm after the front desk has left. He left high-volume practices to open his own. His rules: never knock another office, no pressure lines, no number he can't back.
He's great at the diagnosis. He reads the face before the teeth (the frame they live in, his words) and picks the appliance last. His patients run half kids, half adults: parents booking a child, and adults whose teeth drifted after braces the first time.
By his estimate, 90 to 95% of consults that don't start come down to price. Before anyone reached his chair they had to hear, from him, what they'd be paying for: the diagnosis, the plan, where the teeth end up and how they stay there. The first visit's on him.
- Read the patients first. He rewrote our ad lines in his own words before we shot a frame, and under that sat 6,500+ conversations from patients and practice owners, read for what they fear and want before they book.
- Built and ran the Meta ads. Meta was the whole brief; another agency kept Google and SEO. Audiences, budgets, the landing page, managed daily. Once the winners were clear, I recommended more than doubling the budget, and the practice did.
- Fixed what was quietly broken. 51 tap-to-call links across 17 of his 18 pages dialed Indonesia from a phone, because the number was missing its US country code. The number itself was a tracking line the previous agency had left on every call button. He didn't know it was there.
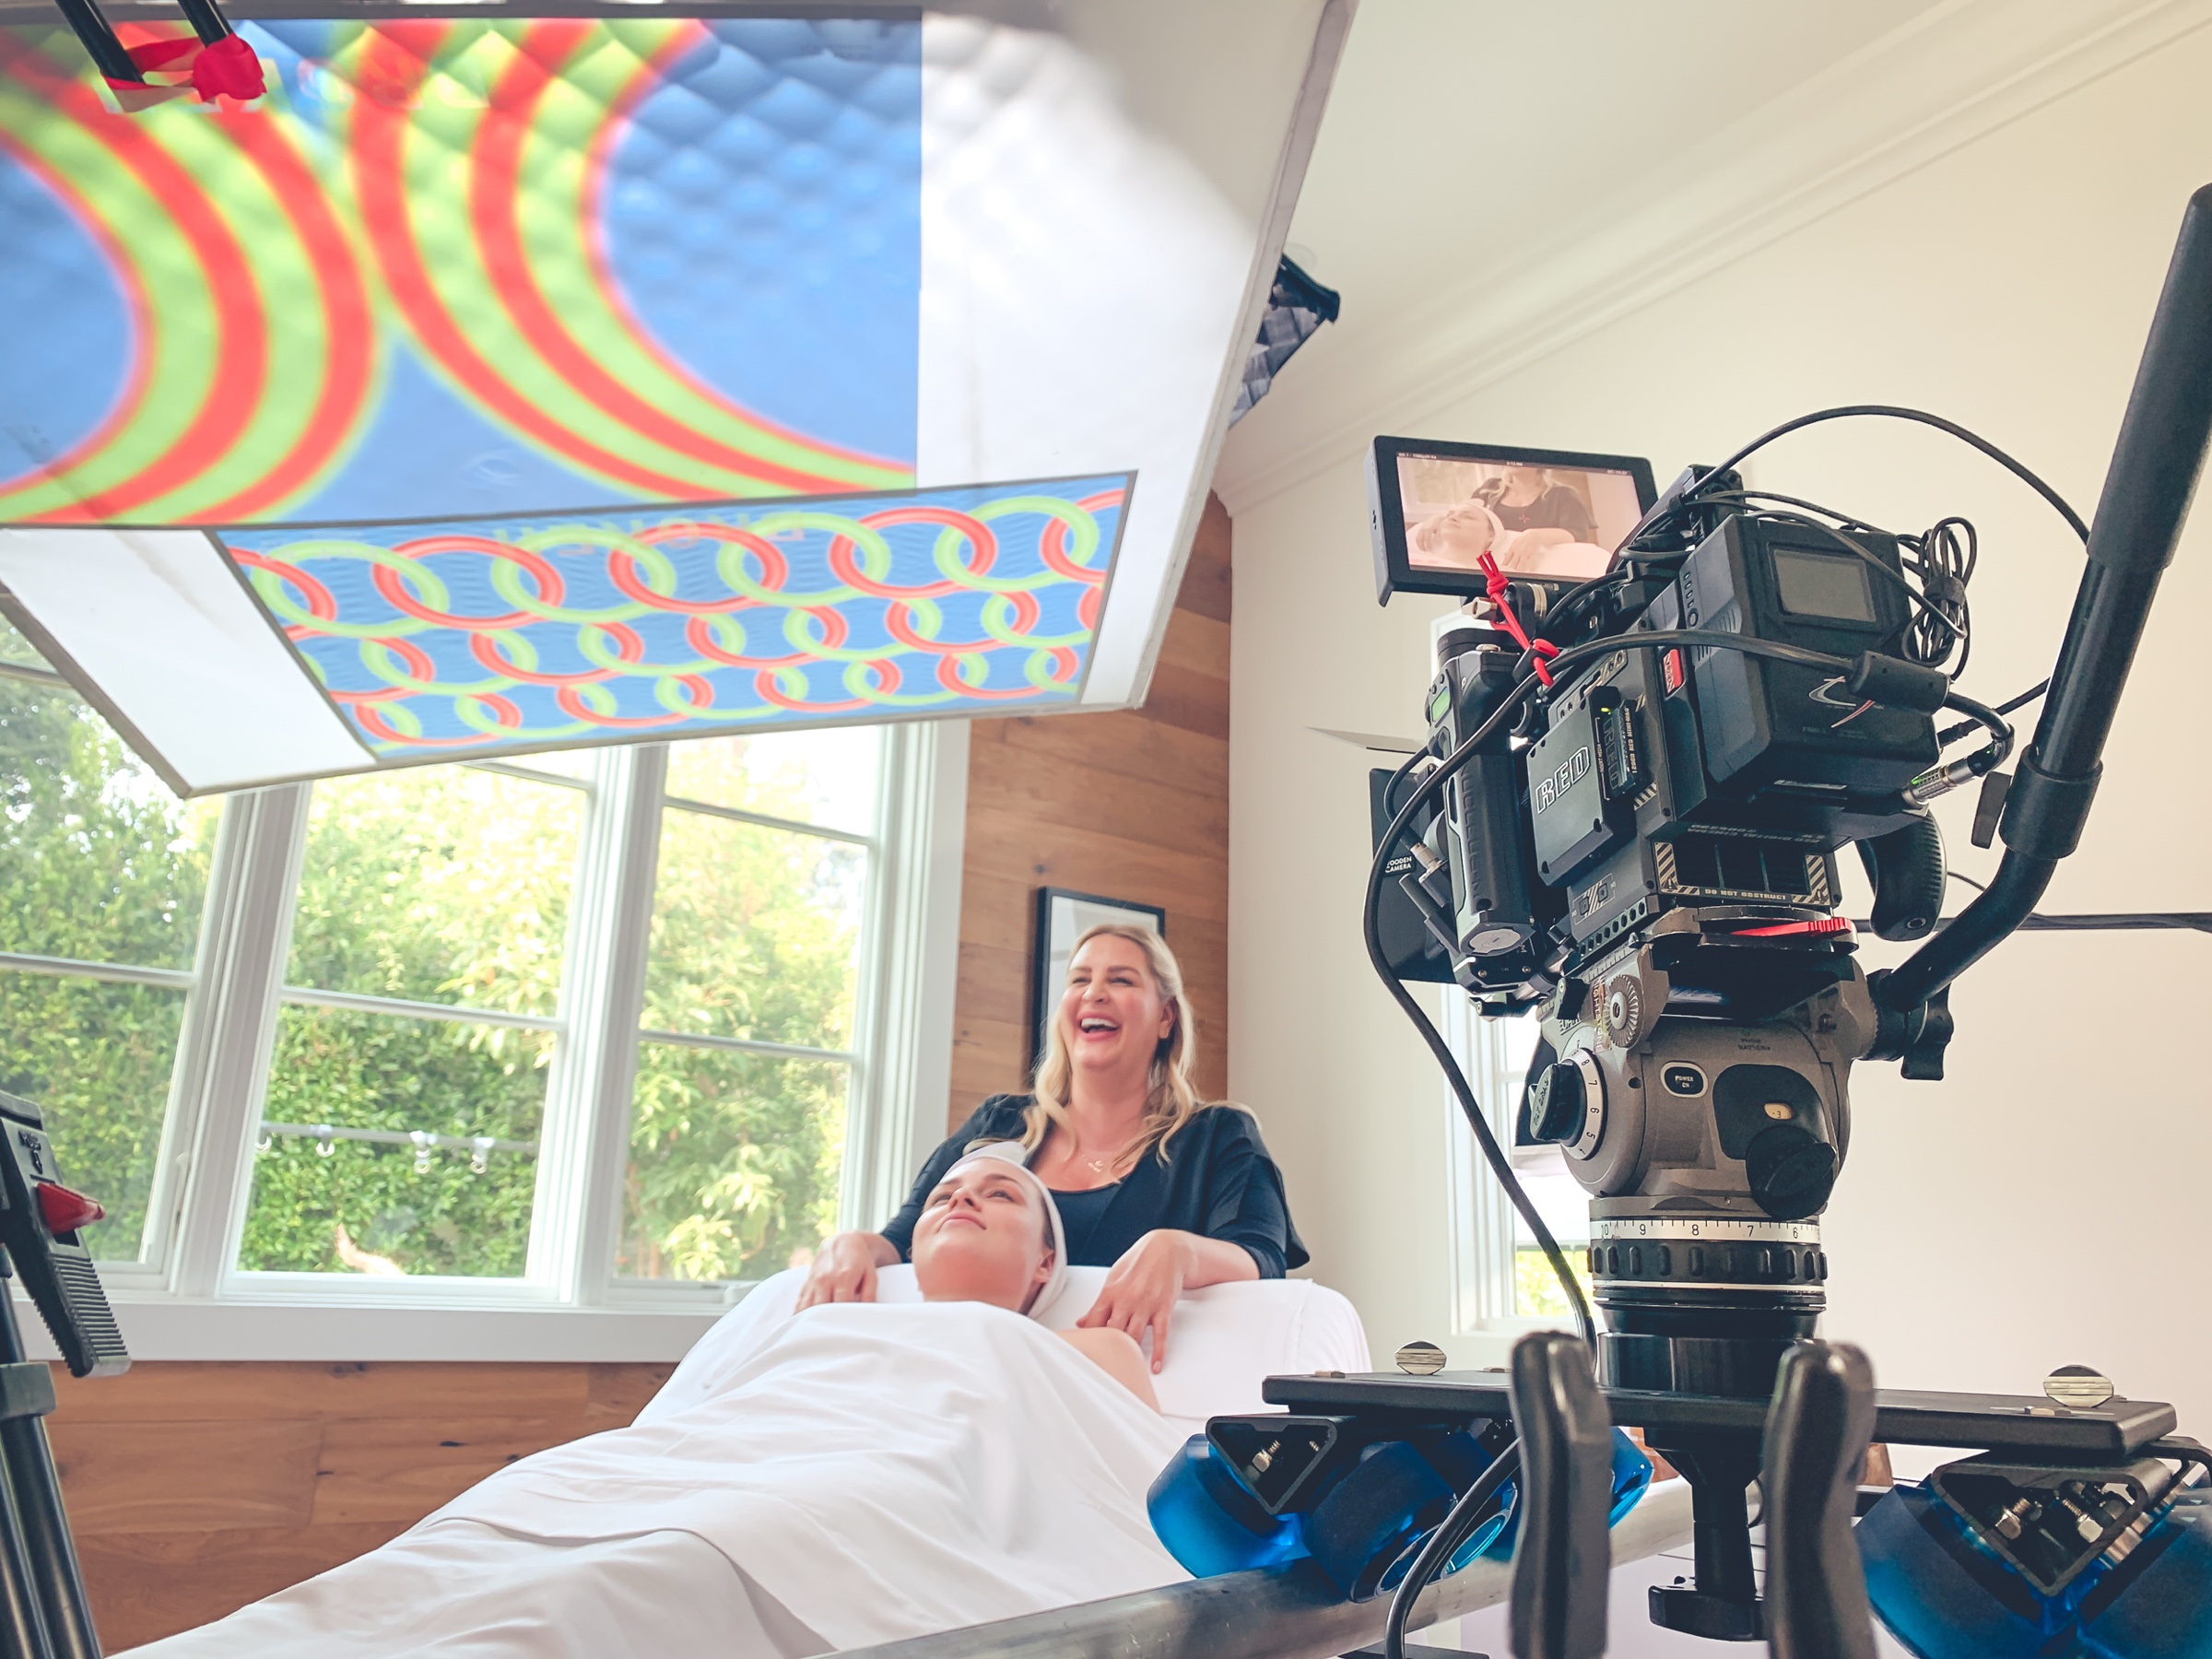
- 1 film day a month. He gives 1 day. I direct, shoot and cut the rest: him on camera, his patients telling their own stories, the practice as a patient sees it.
- Reported patients, not clicks. Every month, in writing, against his own practice records. A patient counts when his system says so, not when Meta does.
Why the practice isn't named here: my call. They're a real practice with real patients, and their name is theirs to give. On a call I'll walk you through the case in as much detail as you want.
What you keep.
Terms come on the call, in writing, before you sign anything. No surprises after.
- Month to month. No lock-in, ever.
- You own the ad account from day 1 and keep every finished piece, the pixel and its data included. Walk anytime and they go with you.
- Your first campaign is live within 30 days of your shoot day, or month 2 is free.
- 1 shoot day a month of your time. I do the rest.
If you want your version of this
Orthodontics, cosmetic and specialty dentistry and aesthetic medicine, in Los Angeles. Before the call, I look at how a new patient finds and books you.
15 minutes. You talk, I listen. No pitch. You leave with my written read on where patients are slipping and what would bring more of them in, whether or not we work together.
Prefer email? smashit@cakesmashmedia.com